Formula 1 stats, 2023 (after 22 races of 22)
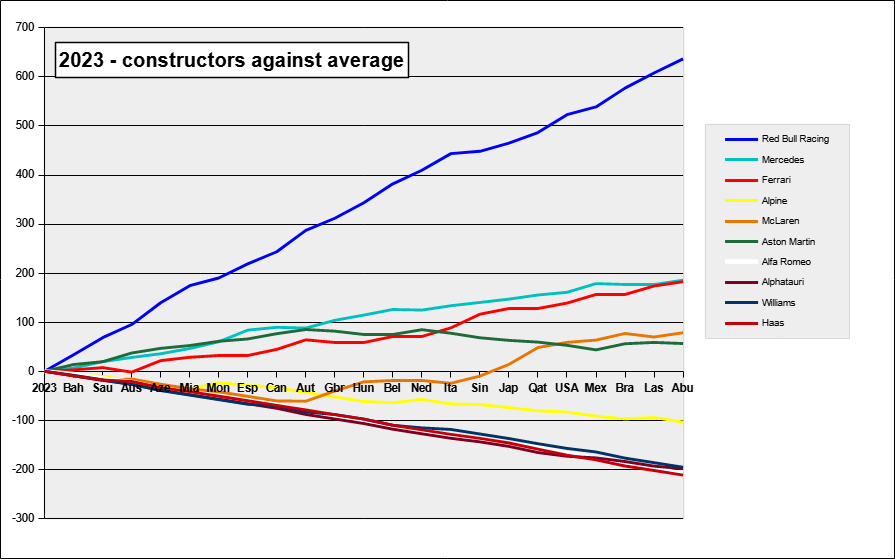
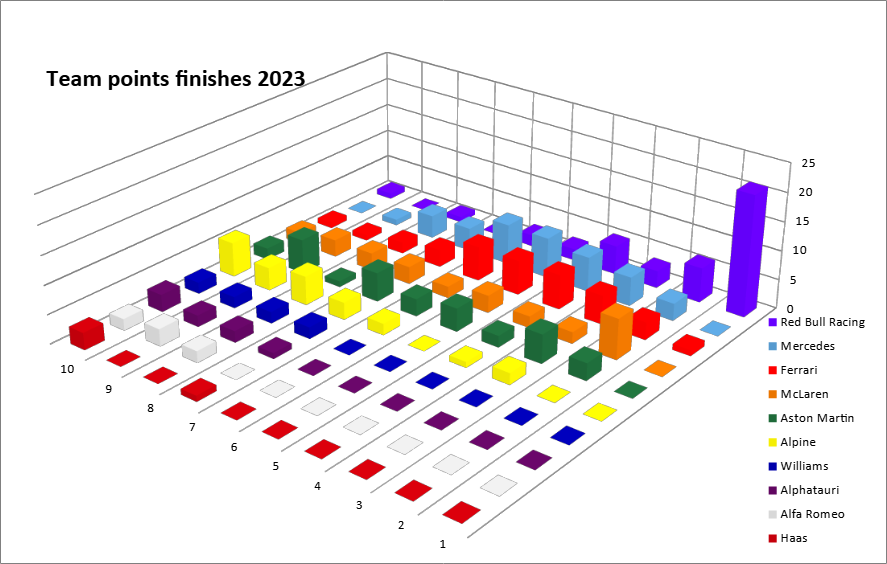
Points
The "average team" scores 10.2 points (with some variation because of sprint races, half points races, and fastest lap not necessarily getting a point). Below average teams are on a downward slope.
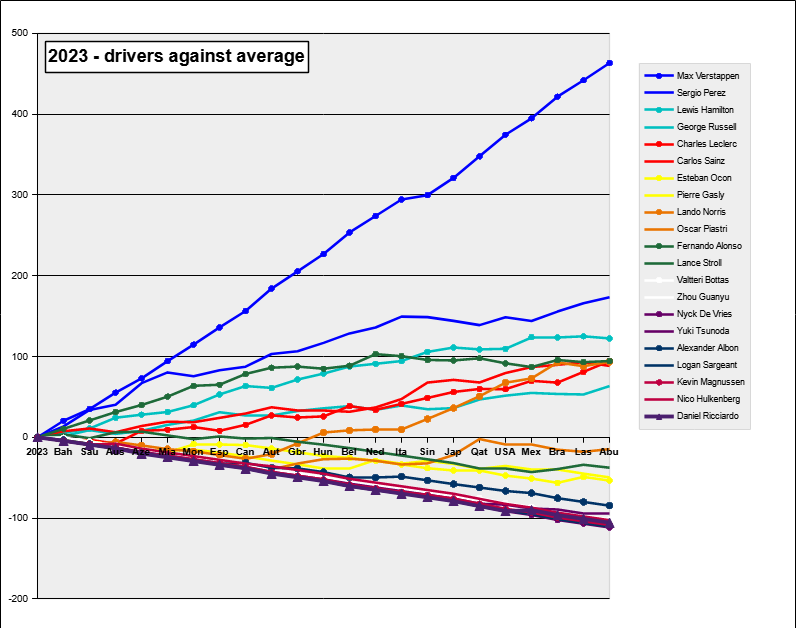
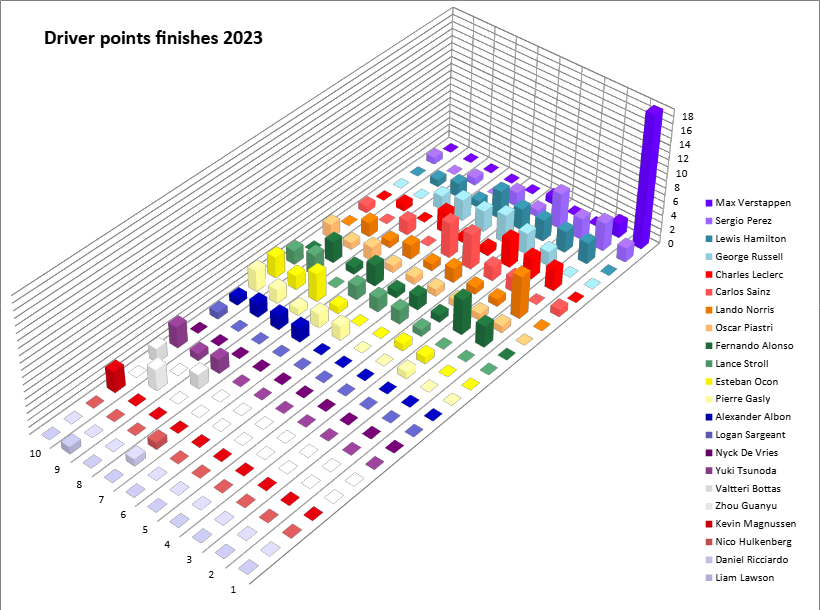
The "average driver" scores 5.1 points (with the same caveats that it can vary). Below average drivers are on a downward slope.
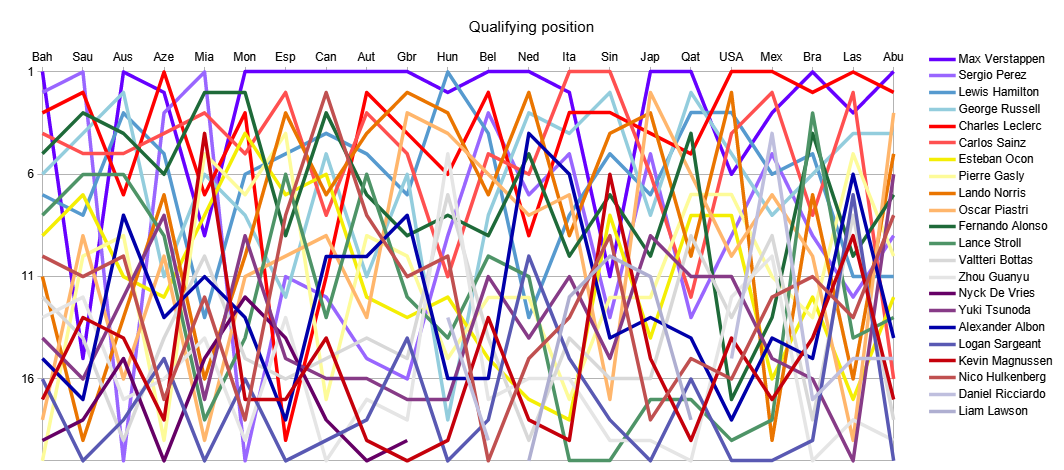
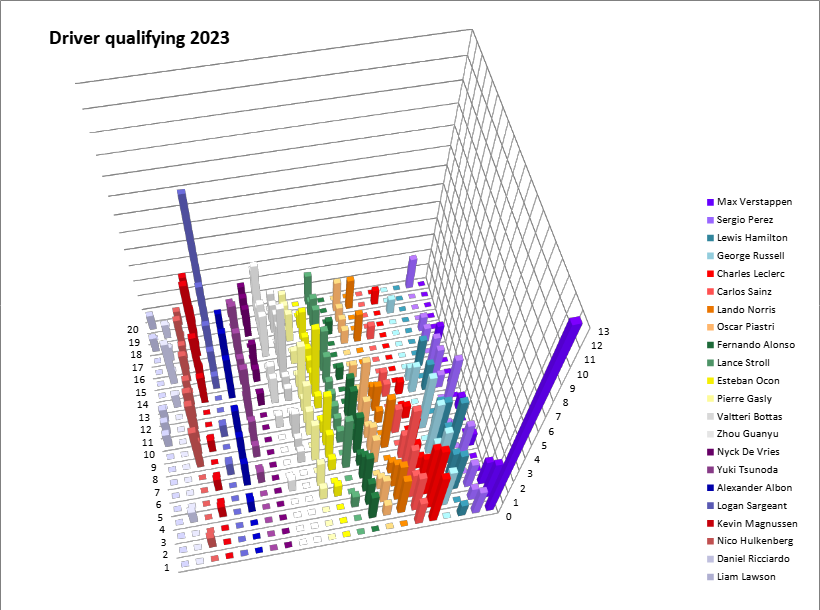
Qualifying
Note: qualifying stats are for normal qualifying, not "sprint shootout", and before any grid penalties are applied.
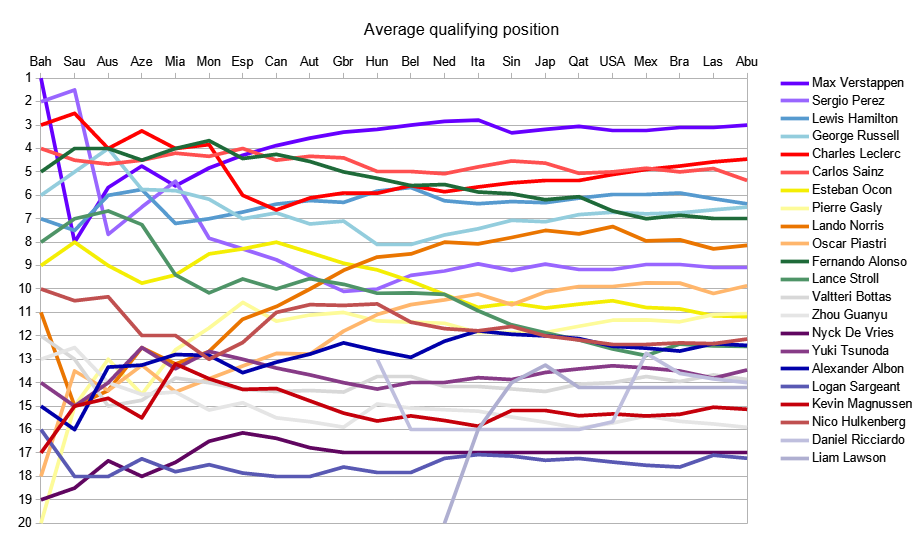
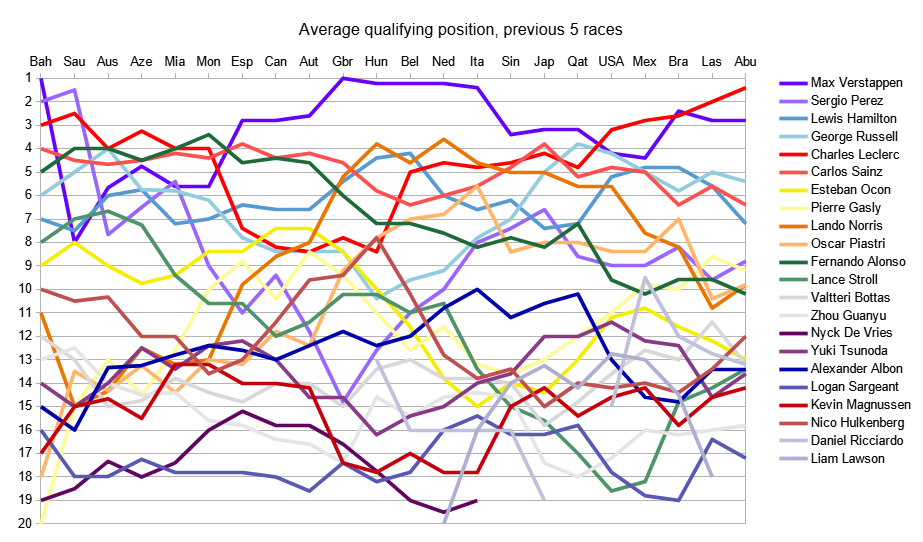
Average qualifying
 3.10  Max Verstappen
 4.57  Charles Leclerc
 4.86  Carlos Sainz
 6.14  Lewis Hamilton
 6.62  George Russell
 7.00  Fernando Alonso
 8.29  Lando Norris
 9.10  Sergio Perez
10.19  Oscar Piastri
11.10  Pierre Gasly
11.14  Esteban Ocon
12.33  Alexander Albon
12.33  Nico Hulkenberg
12.43  Lance Stroll
13.67  Valtteri Bottas
13.81  Yuki Tsunoda
13.83  Daniel Ricciardo
14.20  Liam Lawson
15.05  Kevin Magnussen
15.76  Zhou Guanyu
17.00  Nyck De Vries
17.10  Logan Sargeant
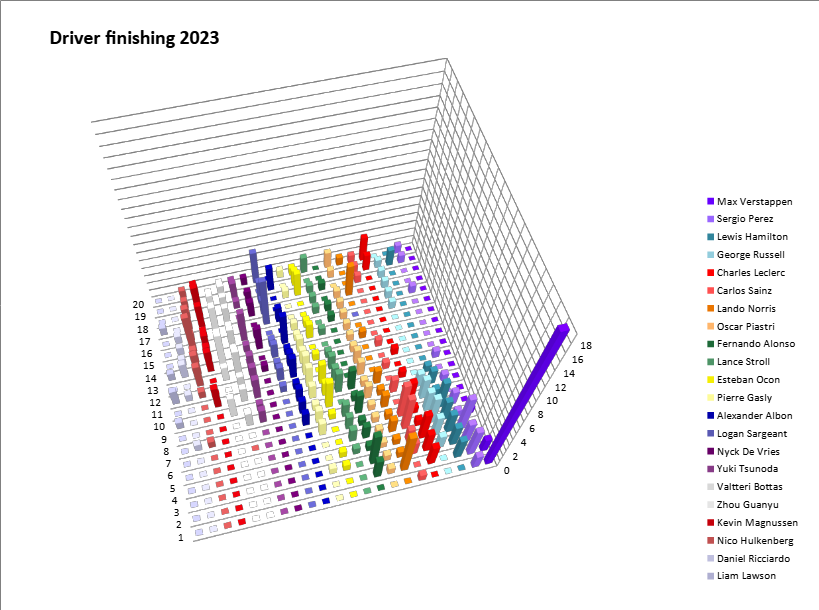
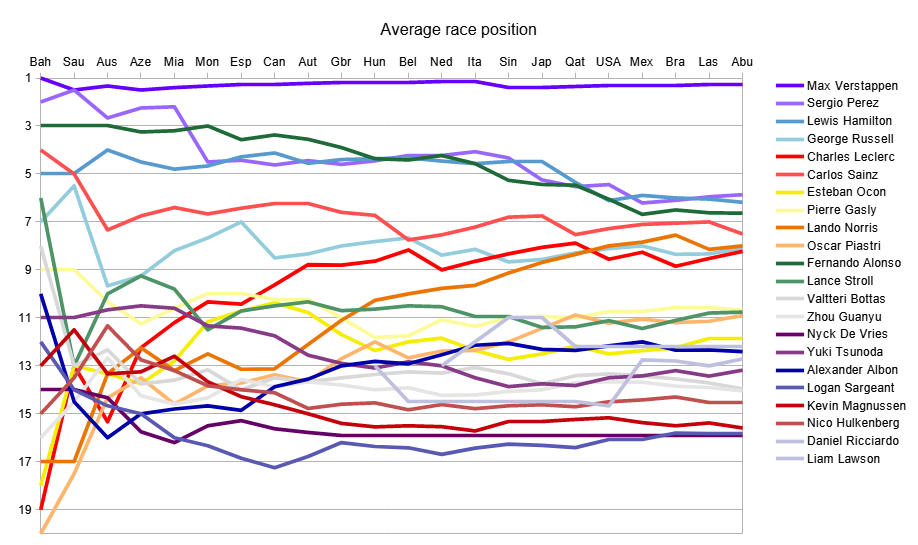
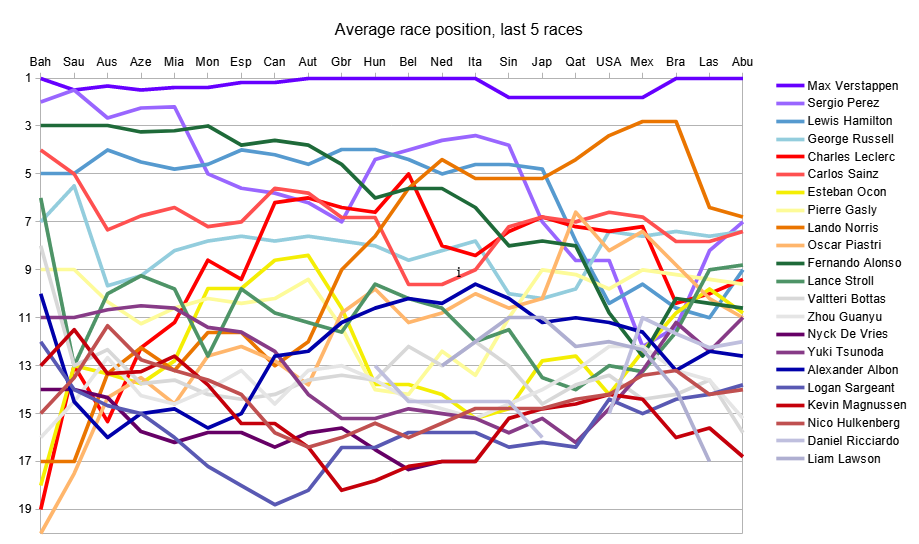
Finishing
Average finishing
 1.29  Max Verstappen
 5.95  Sergio Perez
 6.05  Lewis Hamilton
 6.62  Fernando Alonso
 7.00  Carlos Sainz
 8.14  Lando Norris
 8.33  George Russell
 8.52  Charles Leclerc
10.57  Pierre Gasly
10.80  Lance Stroll
11.14  Oscar Piastri
11.86  Esteban Ocon
12.20  Liam Lawson
12.33  Alexander Albon
13.00  Daniel Ricciardo
13.43  Yuki Tsunoda
13.71  Valtteri Bottas
13.90  Zhou Guanyu
14.52  Nico Hulkenberg
15.38  Kevin Magnussen
15.81  Logan Sargeant
15.90  Nyck De Vries