2021-01-24
Project HausBus: migrating old data
Part 2
Yesterday I spend some time to survey the data I had collected with the existing setup. The collector script still dumps all data points into a simple sqlite database with one simple table. Since moving the viewing of these data sets into influxdb/grafana/web-browser, it seemed like a desirable thing to add the older data into the influx database as well.
- sqlite data exists back until 2010-03-16
- /slow/ sensors are read every 10 minutes, /fast/ ones every 2 minutes.
- With /everything/ this amounts to 3.8 million points per year.
- It had started out with about half that in the first year, so clearly there is a /data inflation/ going on here.
I could have tried to export the sqlite data into some format directly readable by influxdb. But I went the Perl Road again, because I had basically everything I needed. I had made sqlite database files per year and cleaned them a litte from experiments. Then I put together a few snippets already available:
- from the old perl viewer the code to open and query said sqlite databases (usind DBI and the sqlite connector)
- from the current collector the code to prepare a data set and sending it to MQTT.
This was rolling in a short time. However, since I put some "breaks" into the script due to fear to overload the little system collecting everything, this will take /forever/ (several hours per year). But slow is ok. Just now I watch the data points of 2020 rolling in and slowly appear on the grafana view. :)
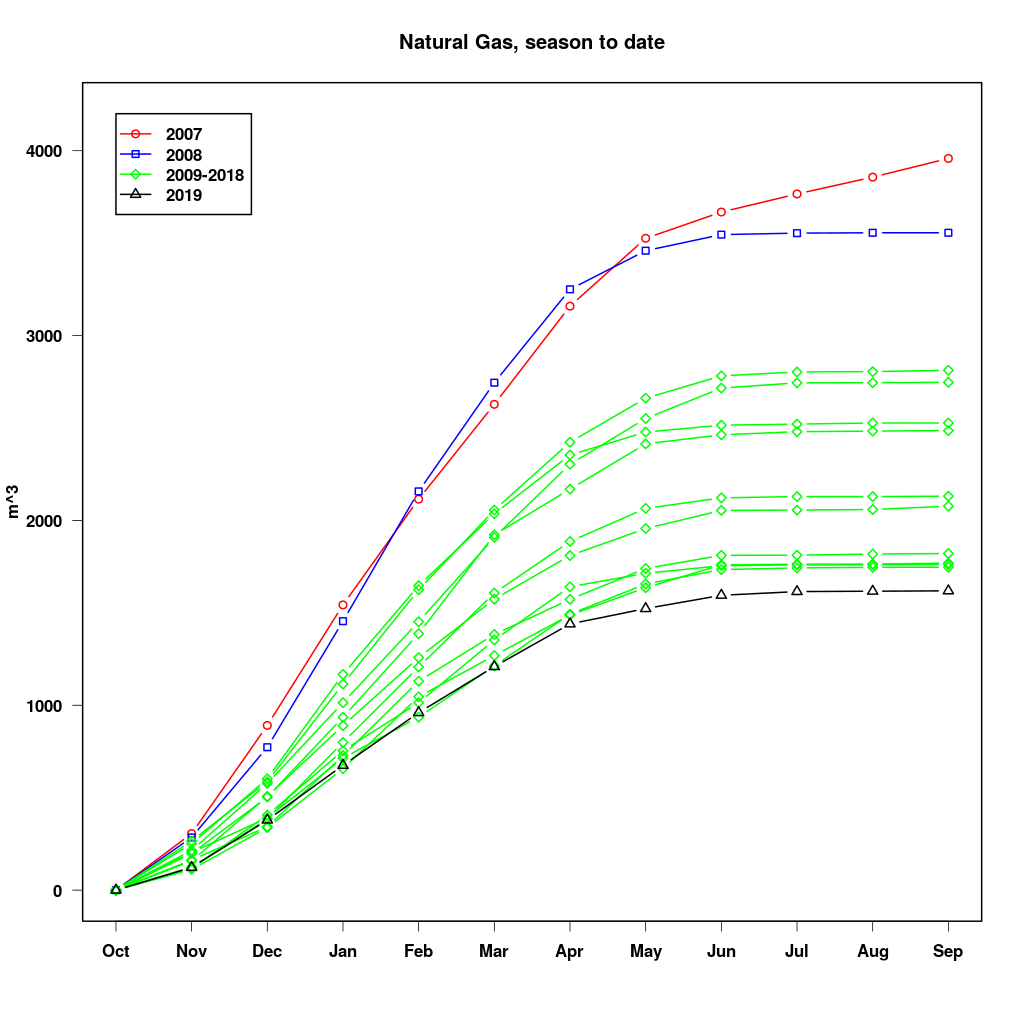
If you live in your own or rented house, I strongly recommend to collect the readings of the meters for electricity, water, natural gas, or from the oil tank or whatever *once a month*, like in the evening before the first of the new month. I happened to start on 1st of October, which turned out to be good. And then create a graph "accumulated consumption over one year". Example (created with Rscript!):
- The plot shows the consumption of natural gas over the course of the season, starting October 1st.
- The values rise steeply over the winter and then go flat over summer (except first year).
- The red line (year 2007/2008) shows the consumption in the first year, when we moved in and understood little.
- The blue line (year 2008/2009) goes flat in summer --- we had added a solar heater. And we switched off the circulation pump, after realizing that it would basically spread heat in the basement for no good reason!
- In the same year we replaced the windows to switch off the /natural/ air exchange with the neighborhood, also known as /neighborhood heating scheme/ :)
- So in the following years consumption fell significantly due to different changes in ventilation and insulation of the building and mild winters (all green lines).
- The black line (year 2019/2020) sees the lowest values so far, which at the very least reduces the bill.
Even if you produce a similar plot manually on a sheet of paper, it will tell you nicely, how you fare.
Cheers,
~ew